
Mastering cryptocurrency charts is a powerful step toward unlocking success in the dynamic world of digital assets. For those starting their journey in 2025, the ability to read and interpret crypto charts transforms confusion into confidence. These charts are vital tools that show historical price movements and volume, enabling you to detect trends that guide smarter trading decisions. Platforms like TradingView and CryptoCompare provide accessible interfaces for beginners eager to explore this analytic realm.
Understanding technical analysis (TA) empowers you to predict future market trends based on past price data, ensuring that every entry and exit is strategic rather than impulsive. Whether you choose to monitor candlestick patterns on Coinbase or track volume spikes on Binance, embracing chart literacy gives you a distinct advantage in navigating the volatile crypto markets. With dedicated resources and hands-on platforms like CoinMarketCap and Kraken, even novices can begin crafting informed trading strategies that limit risks and maximize opportunities.
How Technical Analysis Transforms Crypto Trading
Technical analysis (TA) is not just a buzzword but an essential method for understanding cryptocurrency price behavior. Unlike fundamental analysis, which considers external news and events, TA focuses purely on historical price data and market volume to forecast future movements. This approach is critical for detecting patterns that reveal bullish or bearish trends, helping traders decide when to buy or sell.
By grasping the principles of TA, traders gain clarity and discipline, stripping away emotional decision-making. Noteworthy indicators such as the Relative Strength Index (RSI) and Moving Averages (MA) found on tools like eToro measure market momentum and reveal potential reversal points. This data-driven insight is invaluable, especially in fast-moving environments where timing can determine profit or loss.
Unlocking Market Trends through Popular Crypto Chart Types
Navigating crypto charts starts with understanding the common formats traders rely on. The simplest, line charts, connect closing prices over time, providing an easy overview of long-term trends. However, the most favored by professionals and novices alike are candlestick charts. Each candlestick communicates four vital data points within a specific timeframe—opening, closing, high, and low prices—giving a comprehensive snapshot of market sentiment.
Additionally, OHLC charts (Open, High, Low, Close) offer similar price details but present them in a unique manner, valued by those who prefer concise visualization. For example, you might use Bitstamp or Gemini platforms which provide customizable charts fitting beginners’ needs, enabling close analysis of price patterns crucial for timing trades.
Key Technical Indicators Every Novice Trader Should Know
Beyond charts, several indicators sharpen your market analysis skills. The Moving Average (MA) smooths price data to highlight trend direction, while the Relative Strength Index (RSI) alerts when assets are potentially overbought or oversold. Tools like Bollinger Bands demonstrate market volatility, and the MACD (Moving Average Convergence Divergence) helps identify momentum shifts.
These indicators combine to offer a multi-dimensional view of market dynamics, available on platforms like CryptoCompare and Gemini. Learning to interpret these can improve your timing and risk management, best practices supported by resources such as the Certified Cryptocurrency Trader (CCT) certification courses, guiding you step-by-step to professional-level analysis.
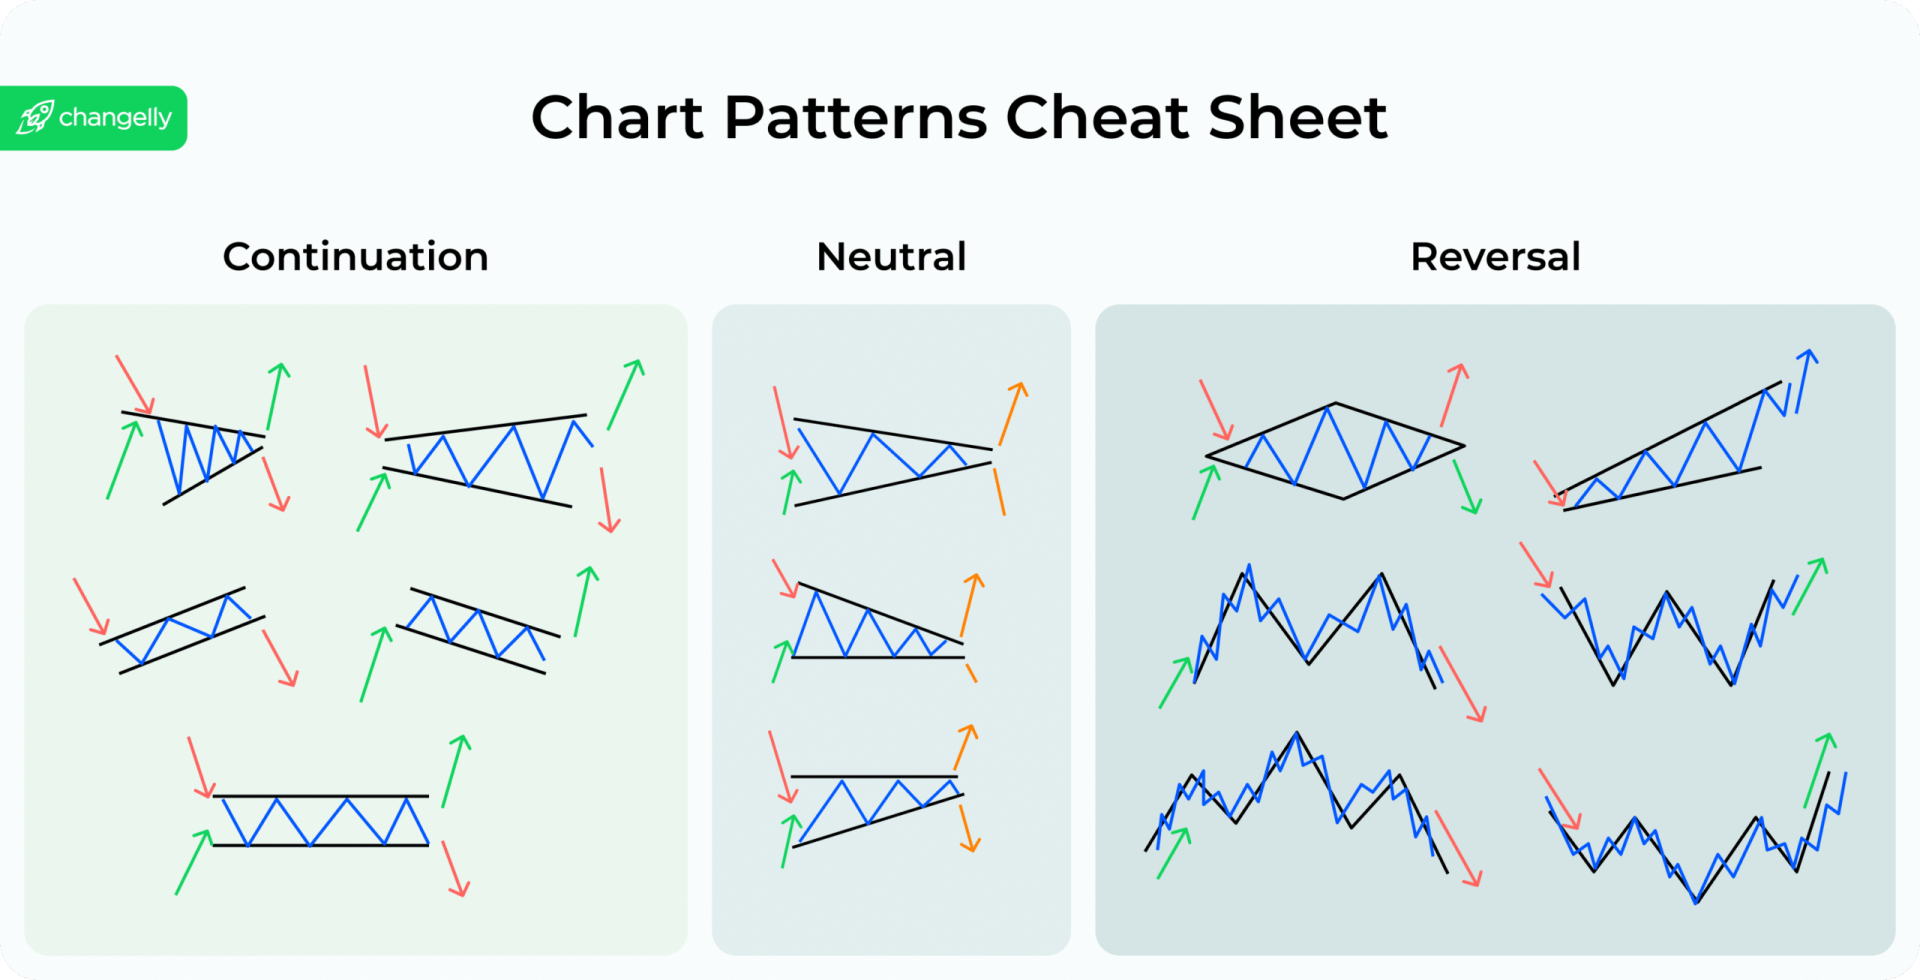
Decoding Chart Patterns: Your Secret Weapon for Market Prediction
Chart patterns such as Head and Shoulders or Double Tops and Bottoms signal potential market reversals, while formations like Triangles and Pennants often predict continuation of current trends. Recognizing these patterns enhances your ability to anticipate price movements before they occur.
For example, spotting a Head and Shoulders pattern on a Kraken candlestick chart may indicate a pending downward trend, prompting timely withdrawal or short positions. Understanding these signals in 2025 is more accessible than ever with user-friendly charting tools and educational platforms like Coinbase and Bitstamp. Deliberate practice using these insights will make you a confident trader.
Volume Analysis: The Pulse of Crypto Market Strength
Volume is often an overlooked but vital element of crypto chart reading. It measures the number of trades within a specific period and confirms trends’ strength or weakness. A strong upward trend paired with high volume suggests genuine market interest, while low volume during a rise may warn of a weak rally.
Platforms such as Binance and eToro display volume data alongside charts to help beginners gauge market conviction. Effective volume analysis is crucial in risk management, ensuring you avoid false breakouts and poorly supported price moves.
Building Your Personalized Crypto Trading Strategy
Once comfortable with reading charts and indicators, the next milestone is developing a tailored trading strategy. Combine multiple technical indicators, chart patterns, and volume cues to decide optimal moments for buying and selling. Incorporate strict risk management by setting stop-loss orders to protect capital.
Emerging traders can benefit immensely from certification programs like the Online Degree in Cryptocurrency & Trading, which emphasize disciplined strategy building. For those starting, practical advice on safely initiating trading accounts on Binance or Coinbase and selecting coins via CoinMarketCap is invaluable. Persistently refining your strategy with real market feedback is the path to long-term success.